04.06.2019, Mirco Widmer
Simunto bietet Softwarelösungen und Unterstützung für die Arbeit mit der agentenbasierten Verkehrssimulation MATSim an. Die Kunden von Simunto werden mit einer Webapplikation unterstützt, die ihnen verschiedene Möglichkeiten anbietet, um Simulationen zu verwalten und zu konfigurieren. Bei der Unterstützung in diesem Bereich wurden wir mit folgenden Herausforderungen konfrontiert:
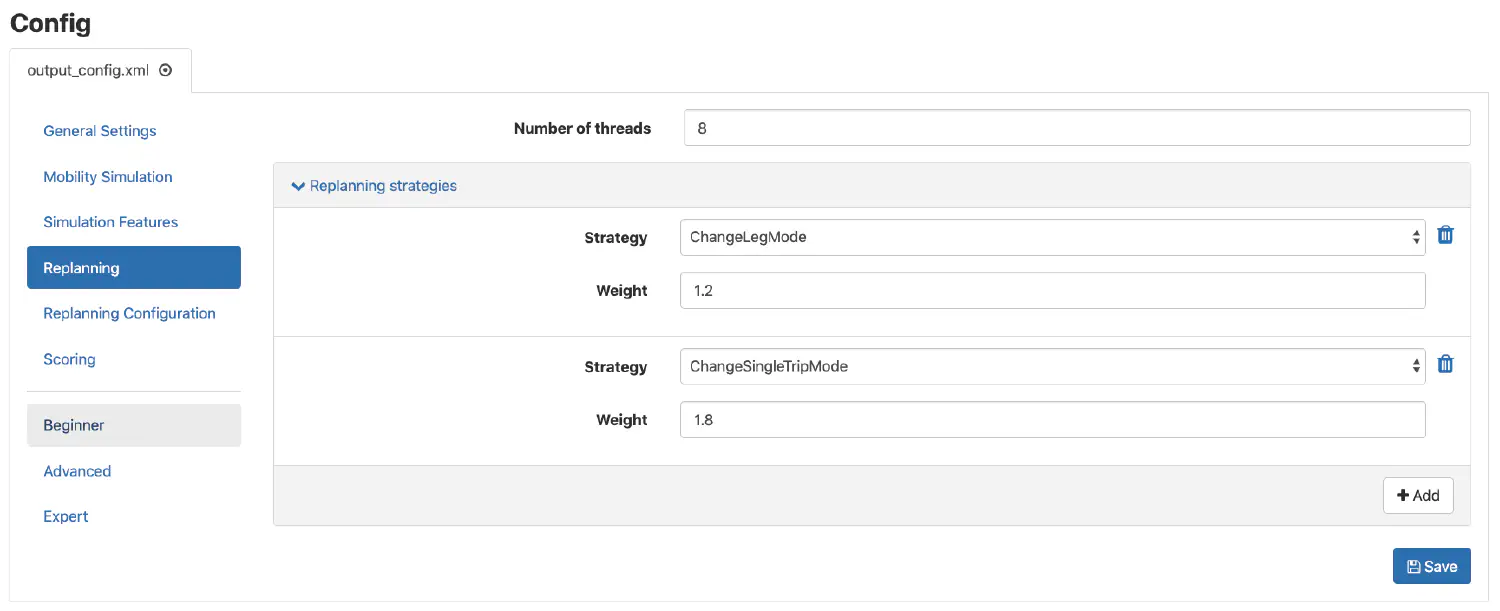
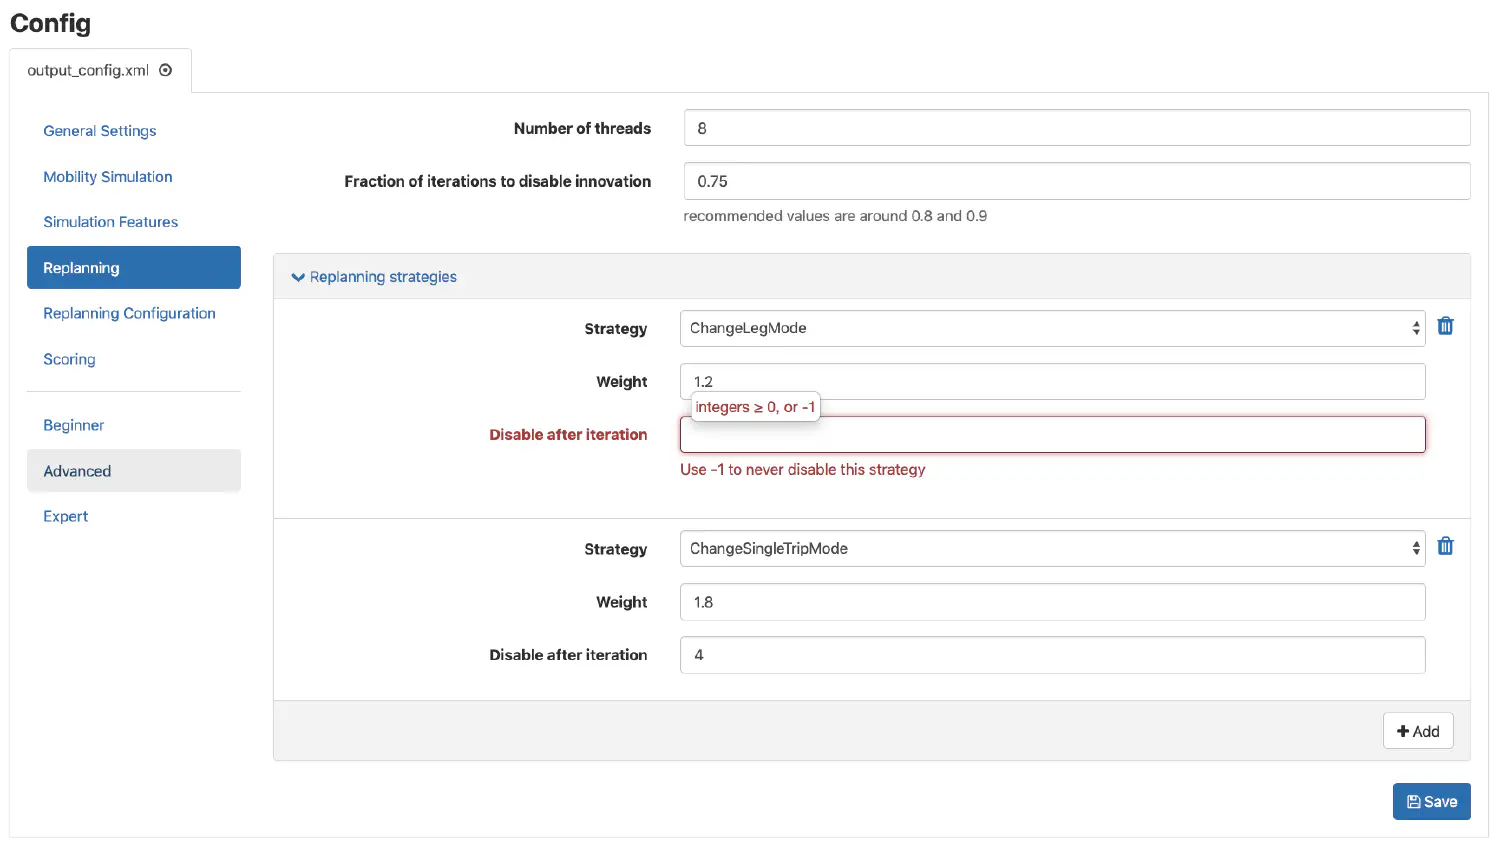
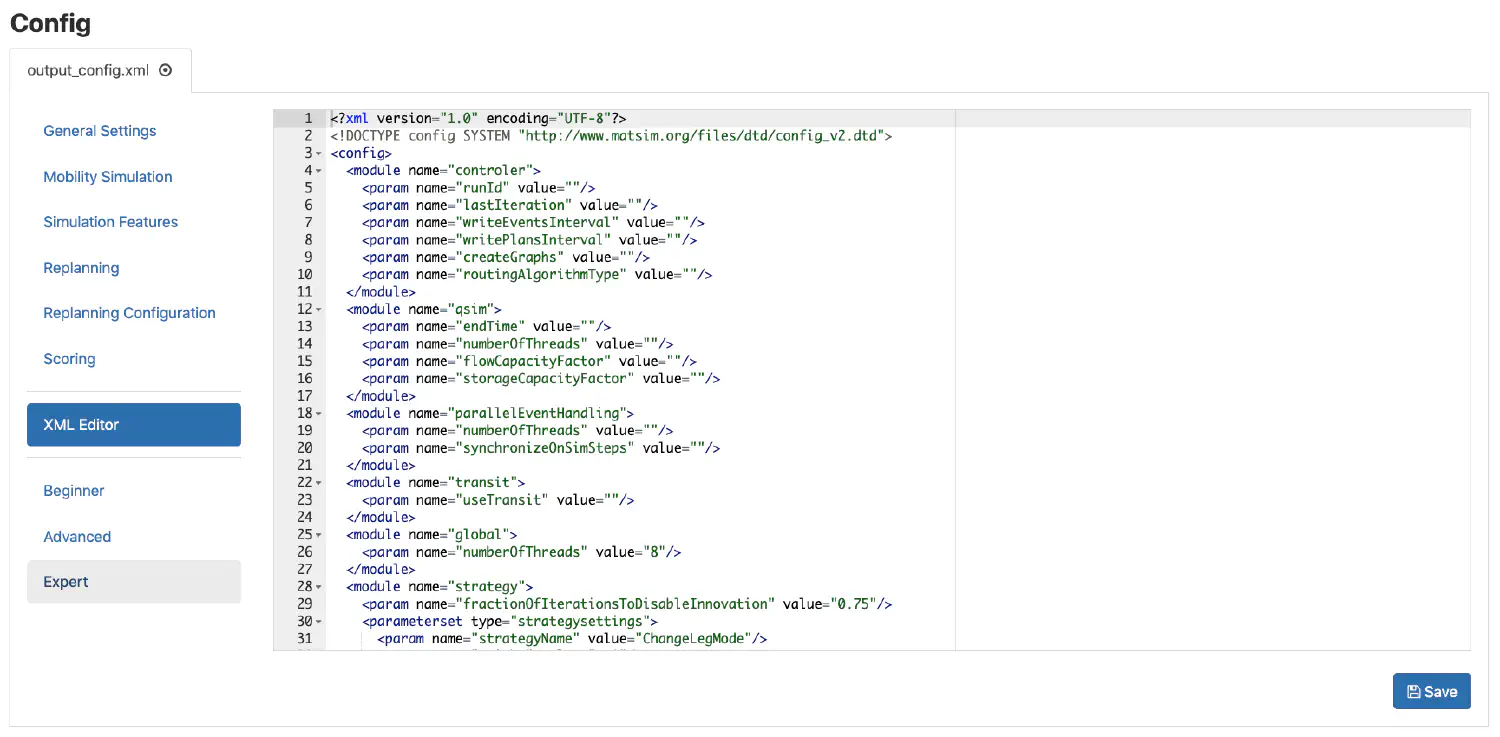
Mit der Möglichkeit, XML-Konfigurationsfiles grafisch zu editieren, schafften wir den Mehrwert, dass die Benutzer nicht mehr XML direkt schreiben müssen. Sie können sich so auf die effektive Konfiguration konzentrieren und das darunterliegende Datenformat ist irrelevant für sie. Je nach Erfahrungsniveau der Benutzer können zusätzliche Bereiche konfiguriert werden.
Mit einem für den grafischen Editor entwickelten Schema wird konfiguriert, welche Konfigurationen in einem bestimmten Kontext konfiguriert werden können. Das Schema definiert die einzelnen Module (hier das Beispiel eines einzelnen Moduls). Die einzelnen Einstellungen sind gruppierbar und wiederholbar und bieten die Möglichkeit einer Validierung.
{
  "modules": [
    {
      "name": "Replanning",
      "categories": ["beginner", "advanced", "expert"],
      "items": [
        {
          "label": "Number of threads",
          "type": "text",
          "binding": "global.numberOfThreads",
          "validation": "^\\d+$",
          "validationMessage": "integers ≥ 0",
          "categories": ["beginner", "advanced", "expert"]
        },
        {
          "label": "Fraction of iterations to disable innovation",
          "type": "text",
          "binding": "strategy.fractionOfIterationsToDisableInnovation",
          "validation": "^1\\.0$|^0\\.?\\d+$|^Infinity$",
          "validationMessage": "numeric value between 0.0 and 1.0.",
          "hint": "recommended values are around 0.8 and 0.9",
          "categories": ["advanced", "expert"]
        },
        {
          "label": "Replanning strategies",
          "type": "group",
          "binding": "strategy.strategysettings",
          "categories": ["beginner", "advanced", "expert"],
          "items": [
            {
              "label": "Strategy",
              "type": "select",
              "binding": "strategyName",
              "selectableValues": [
                "ReRoute", "TimeAllocationMutator",
                "ChangeLegMode", "TimeAllocationMutator_ReRoute",
                "ChangeSingleLegMode", "ChangeSingleTripMode",
                "SubtourModeChoice", "ChangeTripMode",
                "TripSubtourModeChoice"
              ],
              "customValueAllowed": true,
              "categories": ["beginner", "advanced", "expert"]
            },
            {
              "label": "Weight",
              "type": "text",
              "binding": "weight",
              "validation": "^\\d+\\.?\\d+$",
              "validationMessage": "floating point value ≥ 0.",
              "categories": ["beginner", "advanced", "expert"]
            },
            {
              "label": "Disable after iteration",
              "type": "text",
              "binding": "disableAfterIteration",
              "validation": "^-1$|^\\d+$",
              "validationMessage": "integers ≥ 0, or -1",
              "hint": "Use -1 to never disable this strategy",
              "categories": ["advanced", "expert"]
            },
            {
              "label": "Subpopulation",
              "type": "text",
              "binding": "subpopulation",
              "categories": ["expert"]
            }
          ]
        }
      ]
    }
  ]
}
Das GUI basiert auf dem Schema und rendert die Formular-Elemente entsprechend der Definition. So kann das komplexe XML leicht und angepasst auf die Domäne konfiguriert werden.
Im Beginner Modus sind nur die wesentlichsten Konfigurationsmöglichkeiten sichtbar.

Im Advanced Modus können zusätzliche und komplexere Konfigurationsmöglichkeiten verwendet werden.
Im Expert Modus ist es dann ebenfalls möglich das XML-File direkt zu editieren.
Um die Last auf dem Webserver zu minimieren, implementierten wir eine Architektur, die es ermöglicht, dass sich andere Computer beim Server anmelden können, um gewisse Aufgaben zu übernehmen.

Die einzelnen Runners kommunizieren mit dem Server über GRPC. Es können sich beliebig viele Runners beim Server anmelden, was zu einer optimalen Skalierung führt. Der Server kann Aufgaben an spezifische Runners delegieren und erhält eine Antwort, nachdem die Aufgabe vom Runner erfolgreich erledigt worden ist.
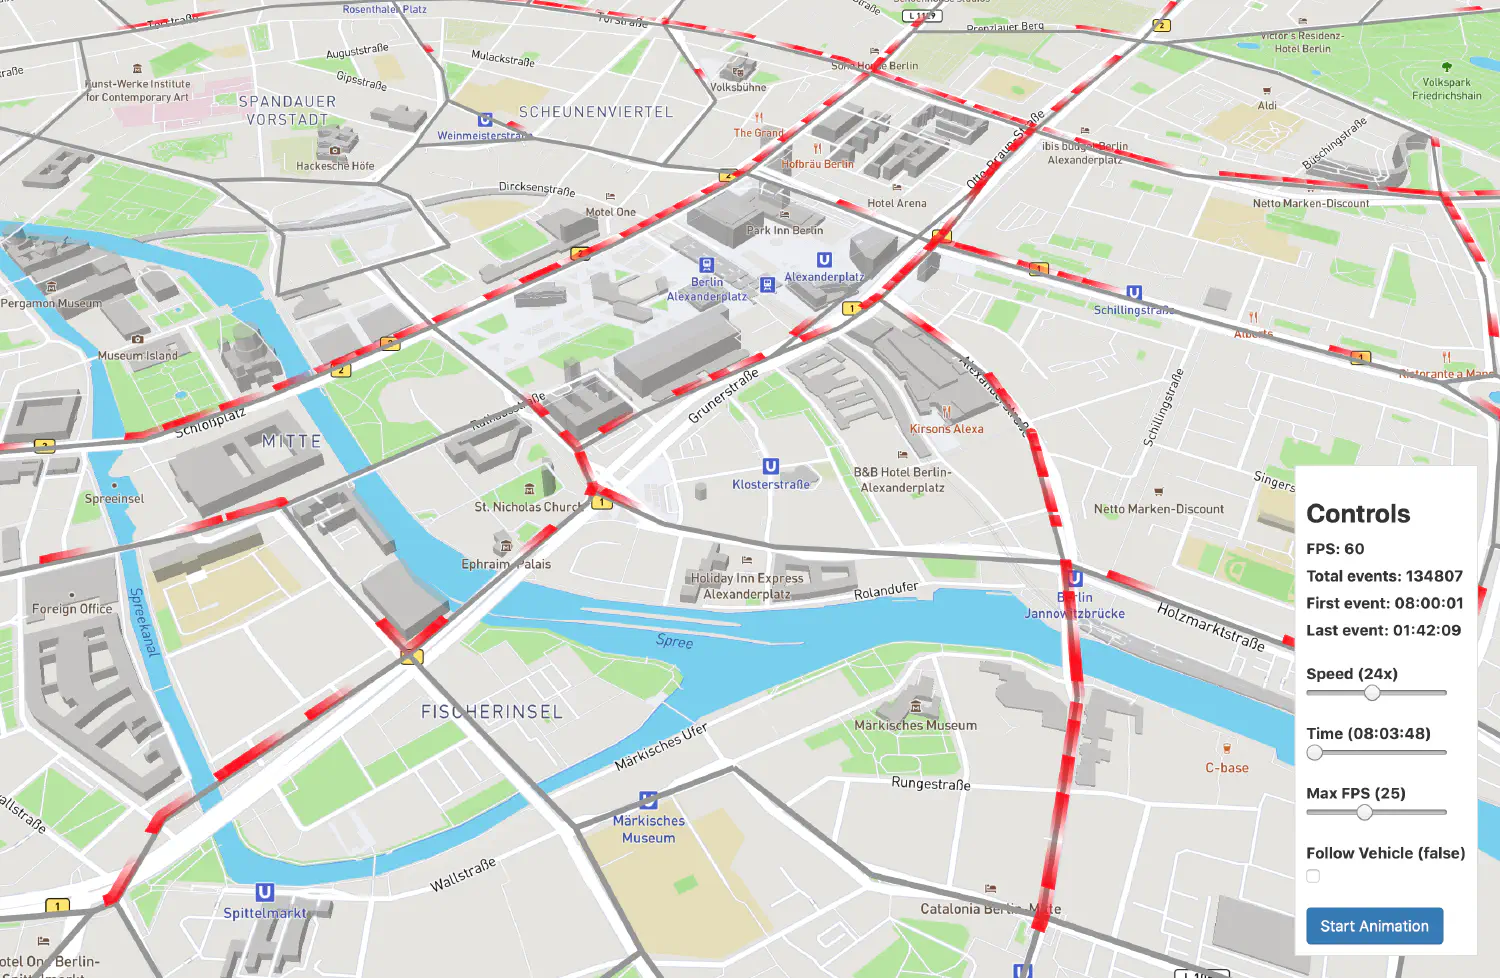
Resultate von MATSim-Simulationen sind unter anderem Bewegungsdaten von Agenten, die zu bestimmten Zeiten an bestimmten Orten sind. Diese Daten können sehr gross werden und sollen im Browser sinnvoll visualisiert werden. Der Server bereitet die geografisch eingeschränkten Daten auf und schickt diese in einem optimierten Binär-Format an den Browser. Im Browser werden einerseits die Bewegungsdaten, aber auch das Strassennetz und Metadaten, mithilfe von deck.gl und Mapbox visualisiert. Die Animation der Bewegungsdaten kann gestartet, gestoppt und deren Geschwindigkeit angepasst werden. Ebenso ist es möglich, weitere Informationen zum darunterliegenden Netzwerk zu erhalten und einen Agenten visuell zu verfolgen.
Die roten Elemente symbolisieren Agenten, die sich über den Zeitraum eines Tages in und um Berlin herum bewegen.
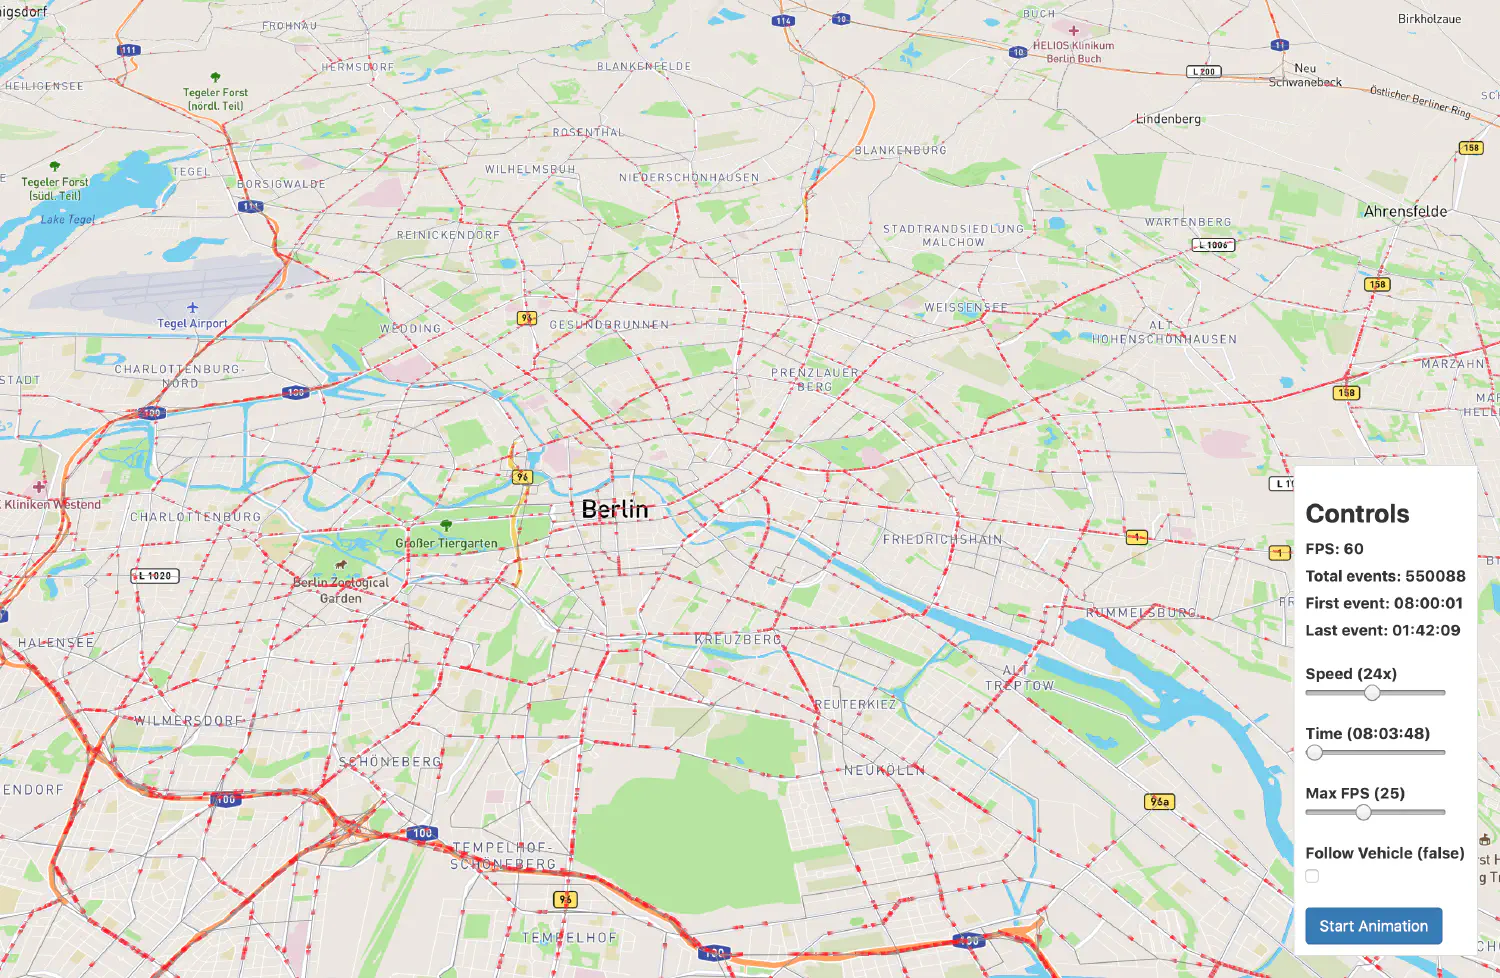
Wenn ganz hineingezoomt wird, dann ist gut sichtbar, wo sich die Agenten genau befinden.
Auf der folgenden Abbildung ist das komplette Strassennetzwerk der Schweiz visualisiert. Es besteht aus tausenden von Strassenabschnitten und alle werden flüssig dargestellt.
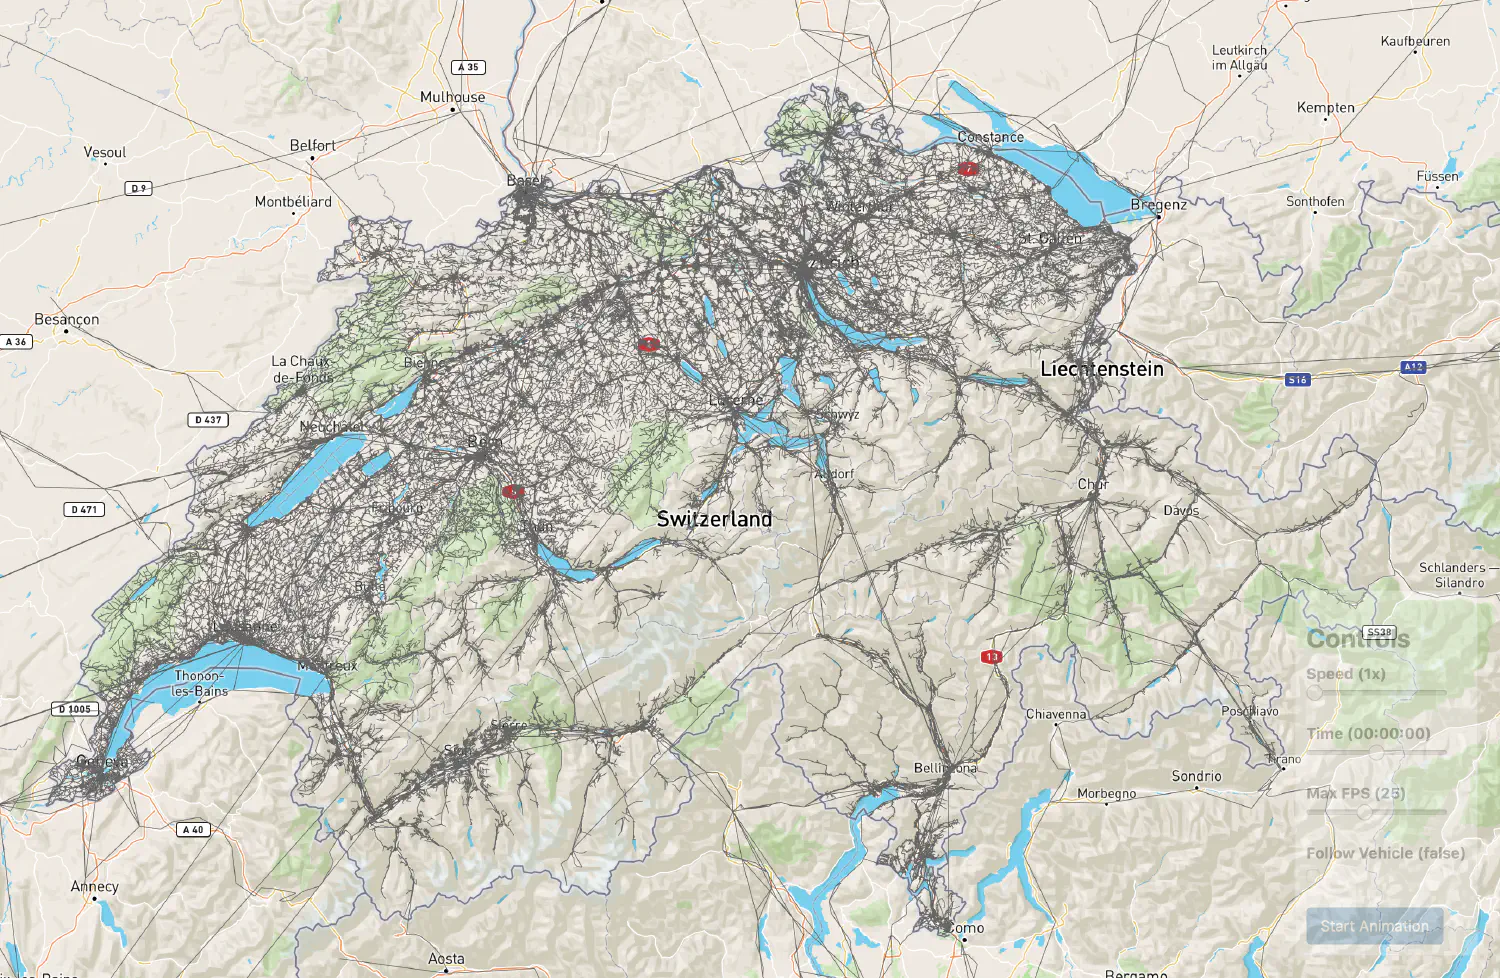
Die Animation zeigt wie sich eine Vielzahl von simulierten Agenten bewegen.
Mein Name ist Christian Mäder. Jeden Freitag nehme ich mir eine Stunde Zeit, um Fragen rund um die Entwicklung und Pflege von Software zu beantworten.
Solche und weitere deiner Fragen beantworte ich dir gerne. Die Stunde steht exklusiv dir zur Verfügung. Sie ist für dich komplett kostenlos und unverbindlich. Du musst dich lediglich anmelden: